for Dummies
Part II
Earth Engine
Michael A Menarguez
mamenarguez@ou.edu
Contents
-
GEE Objects and tools (basics)
-
Sample application exercise for tornado tracking
GEE Objects and tools (Part 1)

- ee.Map
- ee.Image
- ee.ImageCollection
- ee.Geometry
- ee.Feature
- ee.FeatureCollection
- Two exercises (Tornado track, MODIS paddy rice algorithm part 1)
GEE Objects and tools
ee.Map
- Object that can display Image / Features / Geometries
//Prints the viewport of the map
print(Map.getBounds())
//Center map at lon,lat,zoom level
Map.setCenter(-97.4390,35.2058,17)
// Create a rectangle, center it and display it on map
var rectangle = ee.Geometry.Rectangle(-97.4438, 35.2048,-97.4409, 35.2070)
Map.centerObject(rectangle)
Map.addLayer(rectangle)
GEE Objects and tools
Image (I)
- Used to show result in map or to download results
- Can have one or many bands
- An image can cover the whole world!
var myImage = ee.Image(0); // Image with zeros on the whole world
Map.addLayer(myImage,'dumb layer')
var img1 = ee.Image('MOD09GA/MOD09GA_005_2012_03_09'); // From name
var img2 = ee.Image(1) //Constant value
var img3 = ee.Image() //Empty transparent Image
print (img1)
Map.addLayer(img2,{},'equal_to_1');
Map.addLayer(img1.select(['sur_refl_b01','sur_refl_b04','sur_refl_b03'])
,{gain:"0.0255,0.0255,0.0255"},
'MOD09GA');
Map.addLayer(img3,'transparent');
Constructors (just several)
GEE Objects and tools
Image (II)
Some OPERATIONS
Algebraic: add, Subtract, Multiply, Divide
Trigonometric: sin, cos, tan, asin, acos, atan
Binary: eq, gt, gte, lte, and, or, not, leftShift, rightShift
Type: toInt16, toInt32, toLong, toString, toFloat, ...
Other: where, mask, normalizeddifference
Much more in the documentation!
GEE Objects and tools
Image (III)
Example: Load two MOD09A1 world images, calculate ndvi and show their difference in map
var image1 = ee.Image('MODIS/MOD09A1/MOD09A1_005_2010_02_02') //Load image 1
var image2 = ee.Image('MODIS/MOD09A1/MOD09A1_005_2011_02_10') //load image 2
var ndvi1 = image1.normalizedDifference(['sur_refl_b01','sur_refl_b02']) //Shortcut
var ndvi2 = image2.expression('(RED-NIR)/(RED+NIR)',{ //Alternative way
  RED:image2.select(['sur_refl_b01']),
  NIR:image2.select(['sur_refl_b02'])
  });
var ndviDifference = ndvi2.subtract(ndvi1) //Calculate their difference
//This palette will help giving colors to visualization
var palette = ['FFFFFF', 'CE7E45', 'DF923D', 'F1B555', 'FCD163', '99B718',
               '74A901', '66A000', '529400', '3E8601', '207401', '056201',
               '004C00', '023B01', '012E01', '011D01', '011301'];
Map.addLayer(ndviDifference,{min:-1,max:.1,palette:palette})
GEE Objects and tools
Image (IV)
var image = ee.Image('USGS/SRTMGL1_003') //SRTM Digital Elevation Data 30m

var altNaiveClass = ee.Image(0) //Start with an image of zeros

altNaiveClass = altNaiveClass.where(image.lt(500),1) //1: <500m
altNaiveClass = altNaiveClass.where(image.gte(500).and(image.lt(1000)),2) //2: [500m-100m)
altNaiveClass = altNaiveClass.where(image.gte(1000),3) // 3: >=1000m

altNaiveClass=altNaiveClass.mask(altNaiveClass) //Removes all Zeros

Map.addLayer(altNaiveClass)
Example: Load DEM and get image with three classes based on its height
GEE Objects and tools
ee.ImageCollection (I)
- Used to organize sets of images
- Useful if you want to filter a collection by metadata (date, path and row, ...)
- Can map a function over every single image separately (vegetation index, filtering... )
In order to display in map, you need to convert the ImageCollection a single Image! (mean, median, max, ...)

GEE Objects and tools
ee.ImageCollection (II)
Some OPERATIONS
Statistical aggregation: min, max, mean, median, mode, count
Binary: and, or, not
Algebraic Aggregation: Sum, product, ...
Other: merge, map, reduce, filterDate, filterBounds, cast, ...
Much more in the documentation!
GEE Objects and tools
ee.ImageCollection (III)
var myCollection = ee.ImageCollection('MODIS/MOD11A2')
                    .filterDate(new Date(2000,1,1),new Date(2001,1,1))
var medianLST = myCollection.select(['LST_Night_1km'])
      .median() // Select median value, now we have an ee.Image object
      .toFloat() // Transform to float
      .multiply(ee.Image(0.02)) //this band has a 0.02 scale
      .subtract(ee.Image(273.15)) //Transform Kelvin to Celsius
print(myCollection)  //Just for debugging
Map.addLayer(medianLST)
Example: load all MOD11A2 images from 2000 to 2001 and show the median value in map in Celsius
GEE Objects and tools
ee.ImageCollection (IV)
Mapping functions
Example: Get NDVI from the collection MOD09A1 (apply to all images) and extract the maximum ndvi for 2008 for each pixel
function getNDVI (image){
  return image.normalizedDifference(['sur_refl_b02','sur_refl_b01'])
              .select([0],['ndvi']) //Give name to the band and return its value
}

var year = 2008;
var collection = ee.ImageCollection("MODIS/MOD09A1")
  .filterDate(new Date(year,1,1),new Date(year+1,1,1))
print(collection)
collection = collection.map(getNDVI);
print(collection)
var maxNDVI = collection.max()
print(maxNDVI)
Map.addLayer(maxNDVI)
GEE Objects and tools
ee.ImageCollection (V)
Mapping functions with extra parameters
Example: Get NDVI from the collection MOD09A1 and filter observations out of the range [-0.2,1.0] , then return the min
function getNdviFromThreshold(min,max){
  return function(image){
    image =  image.normalizedDifference(['sur_refl_b02','sur_refl_b01'])
    image =  image.where(image.gt(ee.Image(max)),max) //Put zeros in values out of range
    image =  image.where(image.lt(ee.Image(min)),min) //Put zeros in values out of range
    return  image.select([0],['ndvi']) //Give name to the band and return its value
  }
}
var year = 2008, min = -0.2, max = 1;
var collection = ee.ImageCollection("MODIS/MOD09A1")
  .filterDate(new Date(year,1,1),new Date(year+1,1,1));
print(collection);
collection = collection.map(getNdviFromThreshold(min,max));
print(collection);
var maxNDVI = collection.max();
print(maxNDVI);
Map.addLayer(maxNDVI,{max:max,min:min});
GEE Objects and tools
ee.Geometry (I)
Generalization of a geometric shape
Types:
- Point / MultiPoint
- Polygon, Multipolygon
- Rectangle ( useful shortcut)
- from geoJSON
- LinearRing
GEE Objects and tools
ee.Geometry (II)
Example: From landsat 7, calculate ndvi on norman and crop resulting image
var image = ee.Image('LEDAPS/LE7_L1T_SR/LE70270362000024EDC00') //Load image 1
var ndvi = image.normalizedDifference(['B4','B3'])
var rectangle = ee.Geometry(ee.Geometry.Rectangle(-97.4982, 35.1752,-97.3859,35.2624),'EPSG:4326',false)
ndvi = ndvi.clip(rectangle)
var palette = ['FFFFFF', 'CE7E45', 'DF923D', 'F1B555', 'FCD163', '99B718',
              '74A901', '66A000', '529400', '3E8601', '207401', '056201',
              '004C00', '023B01', '012E01', '011D01', '011301'];
Map.addLayer(ndvi,{min:0,max:.1,palette:palette},'ndvi in the polygon')
Example: How i got the Image name?
var rectangle = ee.Geometry(ee.Geometry.Rectangle(-97.4982, 35.1752,-97.3859,35.2624),'EPSG:4326',false)
var imCol = ee.ImageCollection('LEDAPS/LE7_L1T_SR')
          .filterDate('2000-01-01','2001-01-01') // If we do not filter, this takes a long time and resources
          .filterBounds(rectangle) // Need to filter the region we want data too for the same reason
print(imCol)
Prevents Geodesic approximation
GEE Objects and tools
ee.Feature (I)
Geometry associated with an Object (null, Number, List, ...)
Example: Get value of pixels for NLCD water / ice pixels
//Sample layer NLCD
var a = ee.Image('USGS/NLCD/NLCD2001')
//Select only water and snow/ice pixels (11 or 12)
var b = ee.Image(0).where(
        a.select('landcover').eq(11).or(a.select('landcover').eq(12)),
        1
)
Map.addLayer(b.mask(b),{palette:'0000FF'})

var point1 = ee.Geometry.Point([-87.863438, 43.393651])
var point2 = ee.Geometry.Point([-87.8637768, 43.3936994])
Map.addLayer(point1,{color:"00ff00"},'Point1')
Map.addLayer(point2,{},'Point2')
Map.centerObject(point1)
print('Point1 (water)');print(b.sample(point1,30))
print('Point2 (no_water)');print(b.sample(point2,30))
GEE Objects and tools
ee.FeatureCollection(I)
Group of features
//Sample layer NLCD
var a = ee.Image('USGS/NLCD/NLCD2001')
//Select only water and snow/ice pixels (11 or 12)
var b = ee.Image(0).where(
        a.select('landcover').eq(11).or(a.select('landcover').eq(12)),
        1
)
Map.addLayer(b.mask(b),{palette:'0000FF'})
var point1 = ee.Geometry.Point([-87.863438, 43.393651])
var point2 = ee.Geometry.Point([-87.8637768, 43.3936994])
Map.addLayer(point1,{color:"00ff00"},'Point1')
Map.addLayer(point2,{},'Point2')
Map.centerObject(point1)
print('Point1 (water)');print(b.sample(point1,30))
print('Point2 (no_water)');print(b.sample(point2,30))
var featureColelction = ee.FeatureCollection([b.sample(point1,30),b.sample(point2,30)])
print(featureColelction)
GEE Objects and tools
ee.FeatureCollection(II)
How to load your own kml, txt, csv, tsv ?
Sol: Upload to a fusion table! Click for More info
- Prepare your data (csv, kml, kmz, ...)
- Click on create new fusion table
- Upload your fusion table
- Click on share (top right corner)
- Change who can view to public
- Copy the text of the link after docid=
- Import to GEE workspace using:
"ft:docid"
var fusionTableFC = ee.FeatureCollection("ft:1edO826LFvRG_H8A4_TXg6E6pbDtSHei8b5ycDoUK")
print (fusionTableFC)
Map.centerObject(fusionTableFC);
Map.addLayer(fusionTableFC)
Exercises
It is your turn!
Problem: Pepito wants to track June 1st 2011 New England's devastating tornado effects. In order to do so, he is planning to use GEE and changes in vegetation greenness (NDVI).
He thinks that landsat 5 can be used for this task. Code a solution to this problem. There is no need to filter cloud artifacts.
Rectangle coords = [-72.46,42.042,-72.037,42.176]
Tips: Use previous year data from October to compare
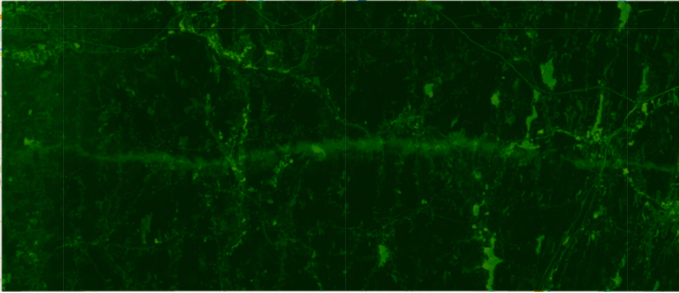
Landsat 5 ndvi median composite from 2010-08-01 to 2010-11-01
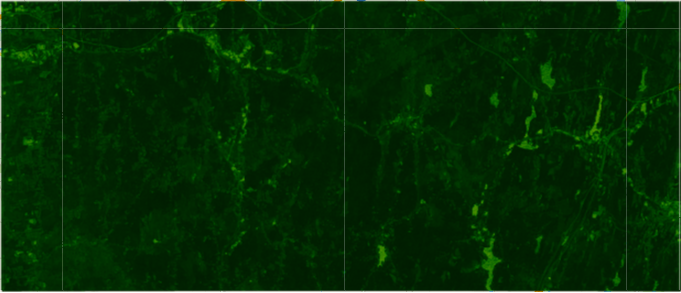
Landsat 5 ndvi median composite from 2011-06-01 to 2011-06-30
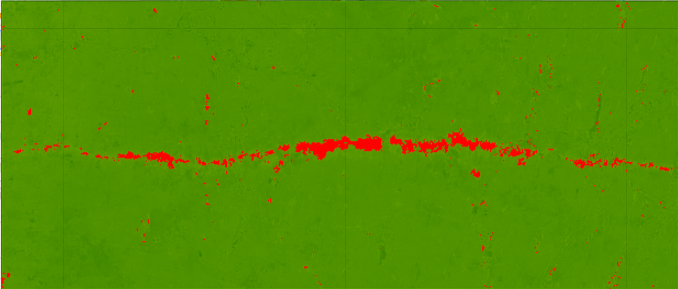
Landsat 5 ndvi median composite difference from images above. The tornado devastating is marked in red (NDVI diff < - 0.2)
var tornadoRectangle =  ee.Geometry(ee.Geometry.Rectangle(-72.460412,42.041943,-72.03708,42.175940),'EPSG:4326' )

var collectionBefore = ee.ImageCollection("LEDAPS/LT5_L1T_SR")
  .filterDate('2010-08-01','2010-11-01')
  .filterBounds(tornadoRectangle)
  .median().normalizedDifference(['B4','B3'])

var collectionAfter = ee.ImageCollection("LEDAPS/LT5_L1T_SR")
  .filterDate('2011-06-01','2011-06-30')
  .filterBounds(tornadoRectangle)
  .median().normalizedDifference(['B4','B3'])

var palette = ['FFFFFF', 'CE7E45', 'DF923D', 'F1B555', 'FCD163', '99B718',
              '74A901', '66A000', '529400', '3E8601', '207401', '056201',
              '004C00', '023B01', '012E01', '011D01', '011301'];

var composite1 = collectionBefore.clip(tornadoRectangle);
var composite2 = collectionAfter.clip(tornadoRectangle);
var difference  = collectionAfter.subtract(collectionBefore).clip(tornadoRectangle);
var tornadoTrail = ee.Image(0).where(difference.lte(-0.2),1)
tornadoTrail = tornadoTrail.mask(difference.lte(-0.2))

Map.addLayer(composite1,{palette:palette},'before');
Map.addLayer(composite2,{palette:palette},'after');
Map.addLayer(difference,{palette:palette},'difference');
Map.addLayer(tornadoTrail,{palette:'FF0000'},'tornado trail')

Map.centerObject(tornadoRectangle)Exercises (II)
Problem: MODIS Paddy rice mapping algorithm (2015 Zhang et. al) requires different masks and products derived from MOD09A1 8-days surface reflectance and other MOD11A2 Land Surface Temperate.
- Get 8-days NDVI, EVI, and LSWI water indices (MOD09A1)
- Get 8-days LST in Celsius (MOD11A2)
- For the four products, visualize them in the map
//################## Aux. functions #############################
//This function receives a MOD09A1 image and returns ndvi, evi, and lswi
function getVegetationIndices(img){
  var ndvi = img.normalizedDifference(['sur_refl_b02','sur_refl_b01'])
  var lswi = img.normalizedDifference(['sur_refl_b04','sur_refl_b02'])
  var evi = img.expression(
      '2.5 * (nir - red) / (nir + 6 * red - 7.5 * blue + 1)',
      {
          red: img.select('sur_refl_b01'),    // 620-670nm, RED
          nir: img.select('sur_refl_b02'),    // 841-876nm, NIR
          blue: img.select('sur_refl_b03')    // 459-479nm, BLUE
      });
  return img.select([]) // Implementation improvement. Need to return same image
              .addBands([ndvi,evi,lswi]) // Add bands to image
              .select([0,1,2],['ndvi','evi','lswi']) //Rename bands
}
//################## Script starts here #############################
var year = 2014 //Easy way to change year in the script
var modisCollection = ee.ImageCollection('MODIS/MOD09A1') //Load MOD09A1 Collecion
                        .filterDate(year+'-01-01',(year+1)+'-01-01') //Filter by year
print('Modis collection');print(modisCollection);
var modisViCollection = modisCollection.map(getVegetationIndices)
print('Modis VI collection');print(modisViCollection);

// Visual representation using median values for each vegetation index
var palette = ['FFFFFF', 'CE7E45', 'DF923D', 'F1B555', 'FCD163', '99B718',
              '74A901', '66A000', '529400', '3E8601', '207401', '056201',
              '004C00', '023B01', '012E01', '011D01', '011301'];
Map.addLayer(modisViCollection.select('ndvi').median(),{palette:palette},'ndvi')
Map.addLayer(modisViCollection.select('evi').median(),{palette:palette},'evi')
Map.addLayer(modisViCollection.select('lswi').median(),{palette:palette},'lswi')
// ################## Aux. functions #############################
//This function returns an image containing the celsius value from a MOD11A2 collection
function convertToCelsius(image){
    var propertyNames = image.propertyNames()
    return image.toFloat()
        // Re-scale (https://lpdaac.usgs.gov/dataset_discovery/modis/modis_products_table/mod11a2)
                .multiply(0.02)
        // Convert Kelvin to Celsius
                .subtract(273.15)
        // Copy properties from original image (timestart, ...)
                .copyProperties(image,propertyNames)
}

// ################## Script starts here #############################
var year = 2014 //Easy way to change year in the script
var collection =  ee.ImageCollection('MODIS/MOD11A2')
                    .filterDate(year+'-01-01',(year+1)+'01-01') //Filter by year
                    .select(['LST_Night_1km']) //Select only the band we want
                    .sort('system:time_start') //Not necessary as of now

var collectionCelsius = collection.map(convertToCelsius) //Convert Collection to celsius
print (collectionCelsius)
// Visual representation using median values
var palette = ['011301', '011D01', '012E01', '023B01', '004C00', '056201',
               '207401', '3E8601', '529400', '66A000', '74A901', '99B718',
               'FCD163', 'F1B555', 'DF923D', 'CE7E45', 'FFFFFF'];
Map.addLayer(collectionCelsius.median(),{palette:palette,min:-20,max:30})
In the next chapter
Can't wait for it, right!
- List
- Array
- Reducing and Filtering
- Charts
- More things!
See you on next class!
Google Earth Engine for Dummies (II)
By Michael a Menarguez
Google Earth Engine for Dummies (II)
This seminar will present the basic concepts required to code using Google Earth engine for Remote Sensing purposes. Part II: GEE basic objects with examples


